A Power BI report on sell-out volume and revenue: what wholesale partners and Meridian's own boutiques sold in 2025. Wholesale Sell-Out and DTC / Boutique are built as two report pages from two different fact tables: partner-reported point-of-sale data on one side, Meridian's own boutique register data on the other.
Both pages are built from fact_sell_out and fact_boutique_sales in meridian.db, loaded via Power Query and joined to their dimension tables. Revenue and units only; no cost or margin data is modeled.
The report
Wholesale Sell-Out and DTC / Boutique, recreated from the Power BI file (downloadable below). Click a month, a partner or store, or any chart bar to filter and cross-filter the page.
How it was built
Built from fact_sell_out and fact_boutique_sales in meridian.db, queried via SQL and loaded into Power BI through Power Query. Local-currency columns are dropped, customer and store names are shortened, and both fact tables connect to their dimension tables, date, geography, channel, and collection, in a star schema. Measures cover core revenue and units, year-over-year comparisons, wholesale coverage and concentration, and a swing measure that flags the largest regional divergence between channels.
Point-of-sale data reported by wholesale partners, read from fact_sell_out. Only accounts flagged reports_sellout = TRUE feed this page: 119 of 224 wholesale accounts. Cut by region, channel, collection, and partner.
Transaction data from Meridian's own boutique register systems, read from fact_boutique_sales, Retail and Online. Covers all 56 boutiques with no partner-reporting dependency. Cut by region, channel, collection, and store.
Cost and margin are not modeled. Both pages report revenue and units only.
What each visual shows
Cross-filtering in the report
Four screenshots of the live report, each with a different filter applied. Click any thumbnail to enlarge.
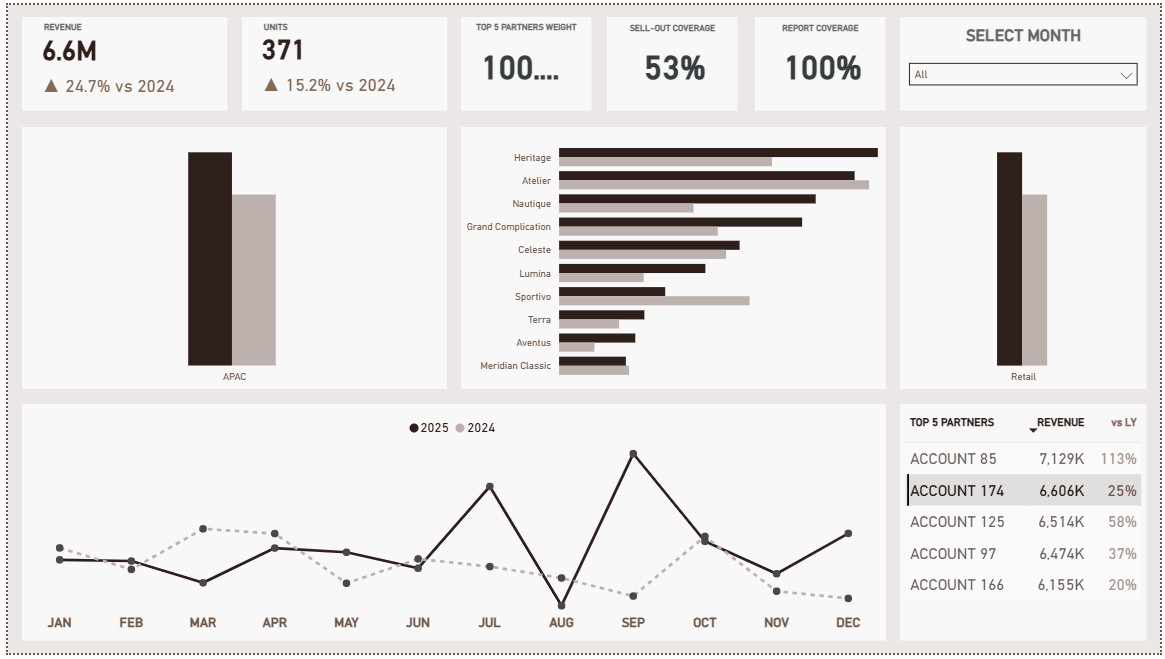
Partner drill-in
Clicking Account 174 in the Top 5 table hard-filters every visual to that one account: region collapses to APAC alone, channel to Retail alone.
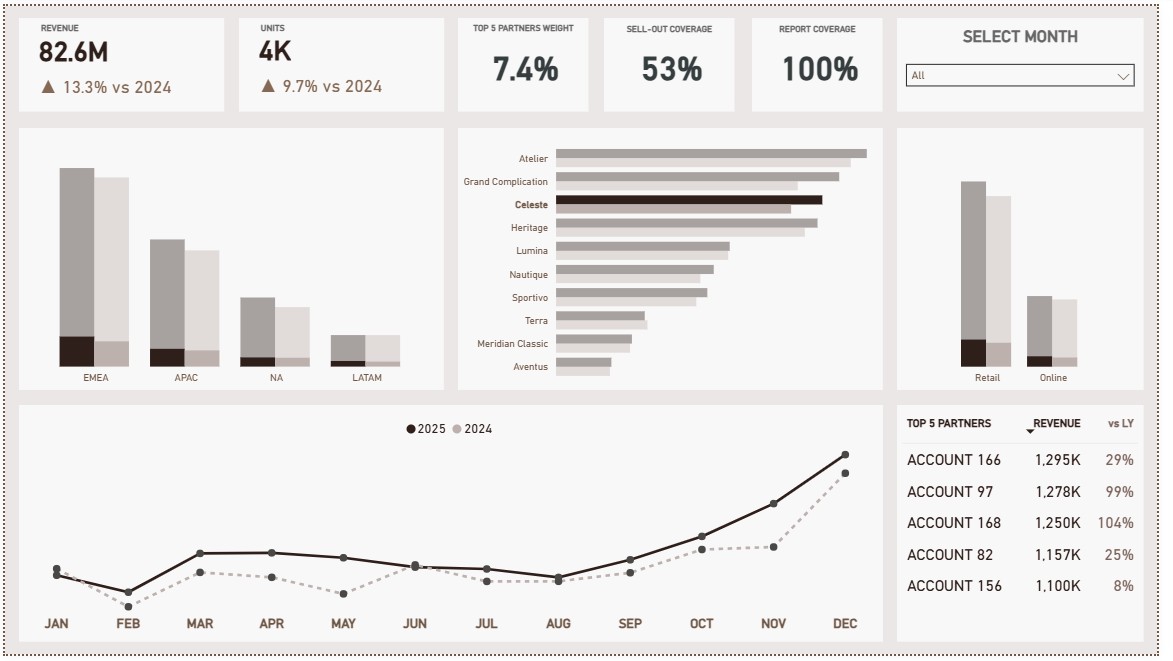
Collection cross-highlight
Clicking Celeste in the collection chart keeps every bar at full-year height and darkens the Celeste share within it; the Top 5 table re-ranks to Celeste's own top partners.
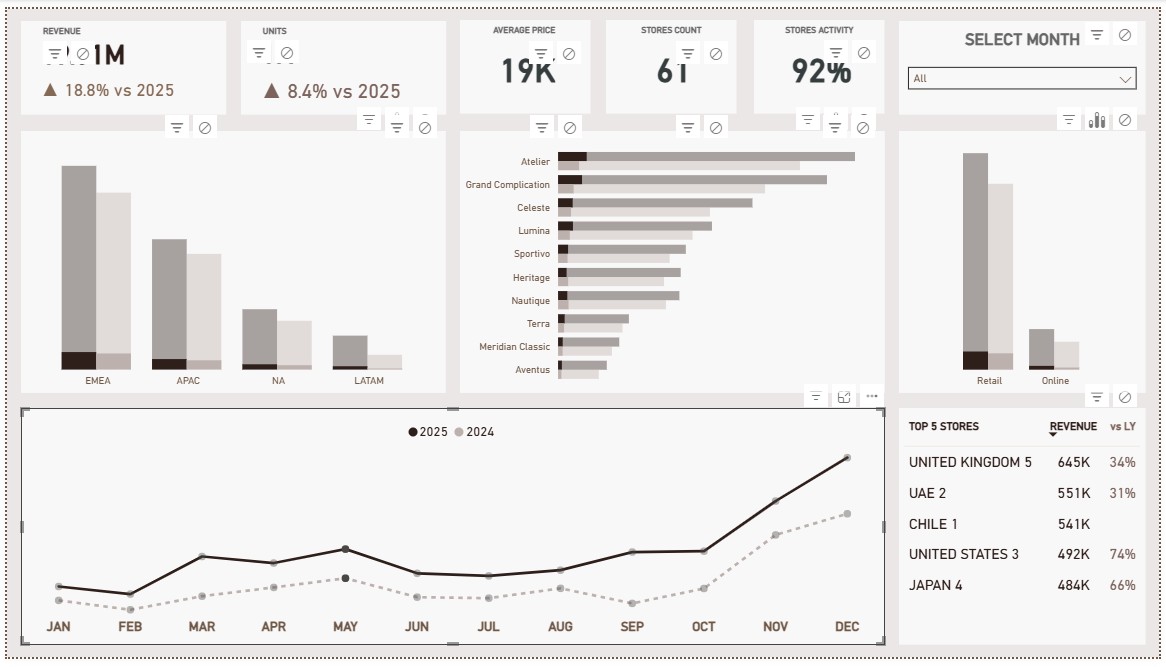
Month slicer
The Select Month control on the DTC page, set to May, filters KPI cards, both bar charts and the store table to that single month.
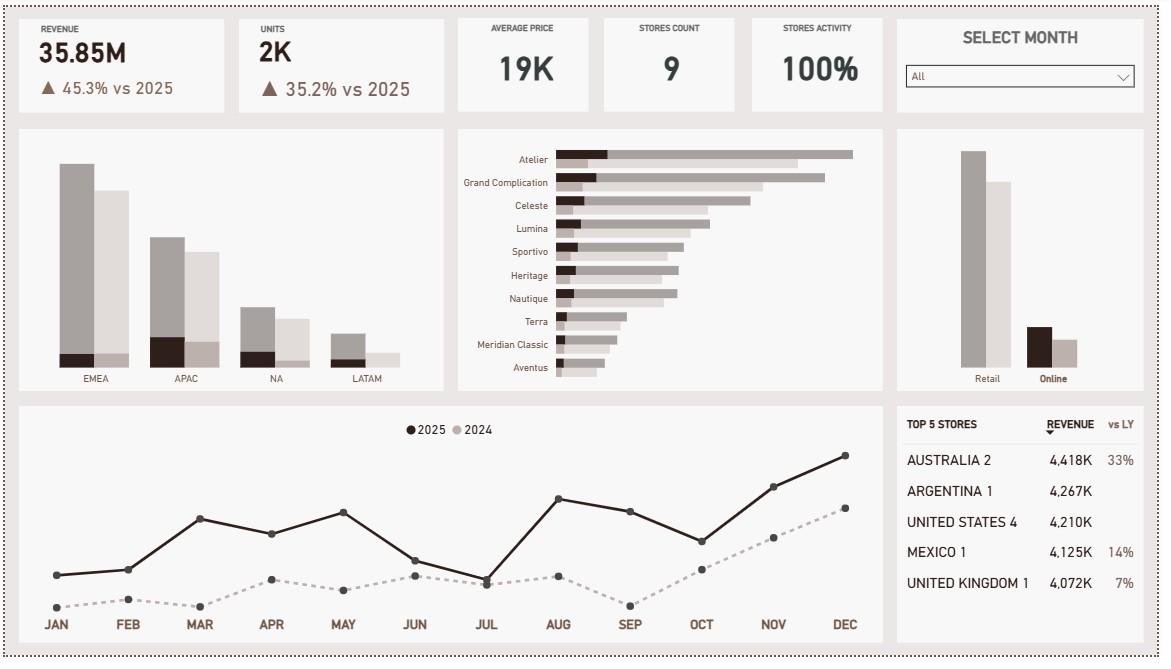
Channel filter
Clicking Online in the channel chart filters the page to Meridian's online boutique sales only, a different Top 5 Stores list than the default, unfiltered view.
Coverage and concentration
Wholesale sell-out coverage by region and channel, partner concentration, and 2025 revenue by region for both report pages.
Wholesale sell-out coverage
119 / 224
53.1% of wholesale accounts report sell-out data. The remaining 105 accounts have no sell-out data on file.
Reporting completeness
97 / 119
Have a full 12-month 2025 record. 20 accounts are missing one month, 2 are missing two; together under CHF 100m of the CHF 565.6m total.
Partner concentration
5.8% / 21.2%
Top 5 / top 20 share of 2025 sell-out revenue. The 119 reporting accounts range from CHF 3.0m to CHF 7.1m.
DTC store base
56 stores
Every boutique shows a full year of transaction history in 2025.
Sell-out coverage by region & channel (accounts)
| Cut | Total accounts | Reporting sell-out | Coverage |
|---|---|---|---|
| EMEA | 106 | 56 | 52.8% |
| APAC | 67 | 35 | 52.2% |
| NA | 36 | 19 | 52.8% |
| LATAM | 15 | 9 | 60.0% |
| Wholesale / Retail channel | 155 | 86 | 55.5% |
| Wholesale / Online channel | 69 | 33 | 47.8% |
| Total | 224 | 119 | 53.1% |
2025 sell-out revenue by region, both pages (CHF, vs. 2024)
| Region | Wholesale 2025 | Wholesale vs 2024 | DTC 2025 | DTC vs 2024 |
|---|---|---|---|---|
| EMEA | 263,565,512 | +4.9% | 108,193,803 | +15.1% |
| APAC | 168,708,578 | +9.4% | 69,184,811 | +12.6% |
| NA | 91,637,455 | +16.2% | 32,023,848 | +23.7% |
| LATAM | 41,729,183 | +0.1% | 17,989,624 | +129.8% |
| Total | 565,640,728 | +7.5% | 227,392,087 | +20.2% |
LATAM shows the largest gap between Wholesale (+0.1%) and DTC (+129.8%) growth, driven by new boutique openings including Chile 1 and Argentina 1.
Controller's commentary
2025 sell-out totaled CHF 565.6m through Wholesale and CHF 227.4m through DTC, up 7.5% and 20.2% on 2024. Neither figure includes cost or margin; both are revenue and units only.
119 of Meridian's 224 wholesale accounts (53%) report sell-out data. Coverage by region: EMEA 52.8%, APAC 52.2%, NA 52.8%, LATAM 60.0% (15 accounts). By channel: Retail 55.5%, Online 47.8%.
Report Coverage measures 100%: every reporting account has at least one row of 2025 sell-out data on file. Tested against a full 12-month record instead, 97 of the 119 reporting accounts have one, 20 are missing one month, and 2 are missing two. The 22 incomplete accounts account for under CHF 100m of the CHF 565.6m total.
The top 5 wholesale accounts hold 5.8% of sell-out revenue; the top 20 hold 21.2%. Among the 119 reporting accounts, revenue ranges from CHF 3.0m to CHF 7.1m.
DTC covers 56 boutiques, each with a full year of transaction history in 2025. Boutique sales are captured directly in Meridian's own register systems rather than reported by a third party, so DTC has no equivalent of the Wholesale reporting-coverage gap.
Both channels follow the same seasonal pattern: low from January through August, then a build through Q4 that peaks in December. Wholesale's December revenue is roughly double its August low. DTC's December revenue is roughly double its February low.
LATAM shows the largest regional divergence between channels (the output of the Largest Regional Swing measure): Wholesale grew 0.1% in 2025 while DTC grew 129.8%, driven by new boutique openings including Chile 1 and Argentina 1. The FY2026 Budget Model plans a similar shift for Colombia and Thailand: reduced wholesale volume as new boutiques open in both markets. Within DTC, Online grew faster than Retail (45.3% vs 16.5%).
Source files
The Power BI file behind the report, plus a full static export of both pages.
2025 sell-out totaled CHF 565.6m through Wholesale and CHF 227.4m through DTC, up 7.5% and 20.2% on 2024. 119 of Meridian's 224 wholesale accounts (53%) report sell-out data; coverage runs 52-60% across all four regions and both wholesale channels.
The top 5 wholesale accounts hold 5.8% of sell-out revenue, the top 20 hold 21.2%. Both channels follow the same seasonal pattern: low from January through August, then a build through Q4 that roughly doubles revenue by December.