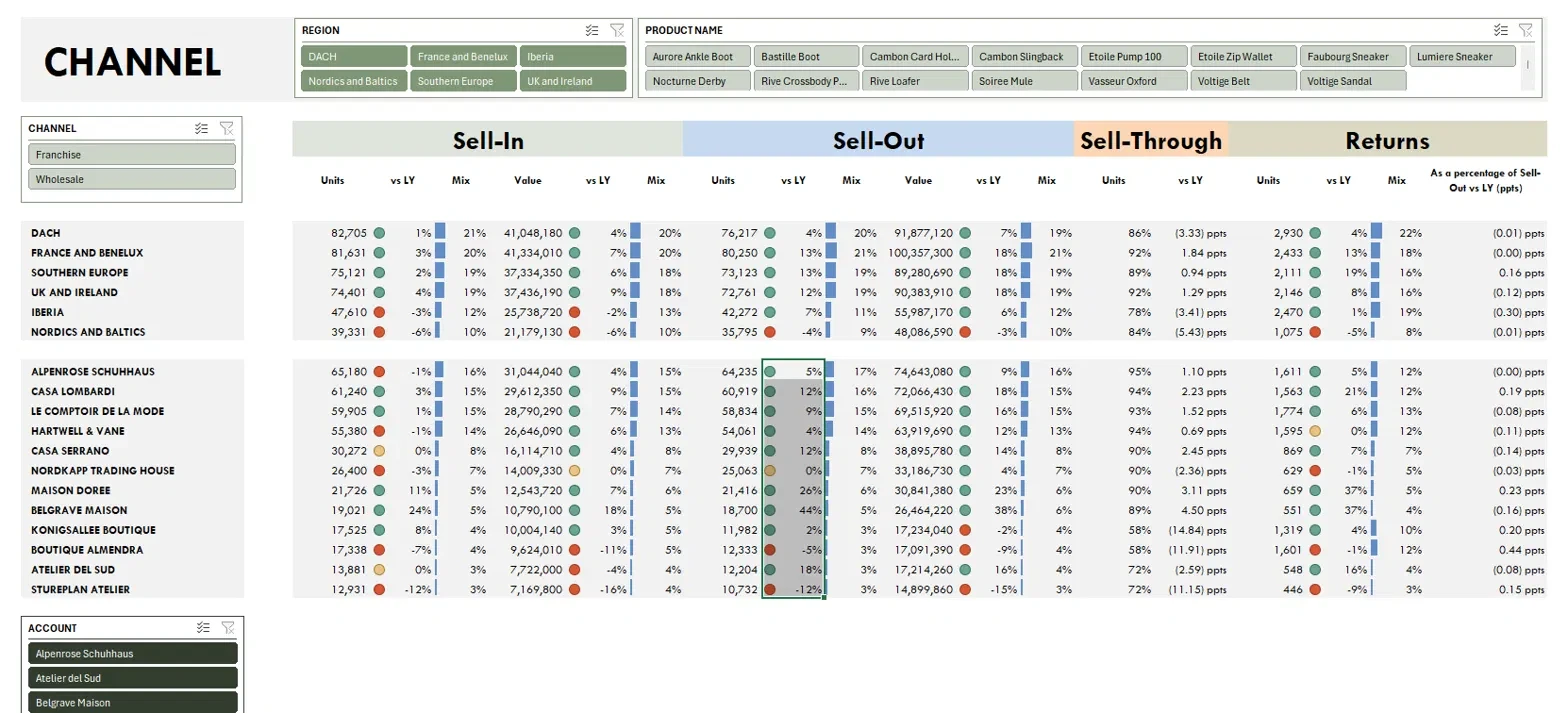
A dashboard covering the core of the role: Sell-In, Sell-Out, Sell-Through %, and Returns — sliceable by month, season, division, region, channel, account, and product.
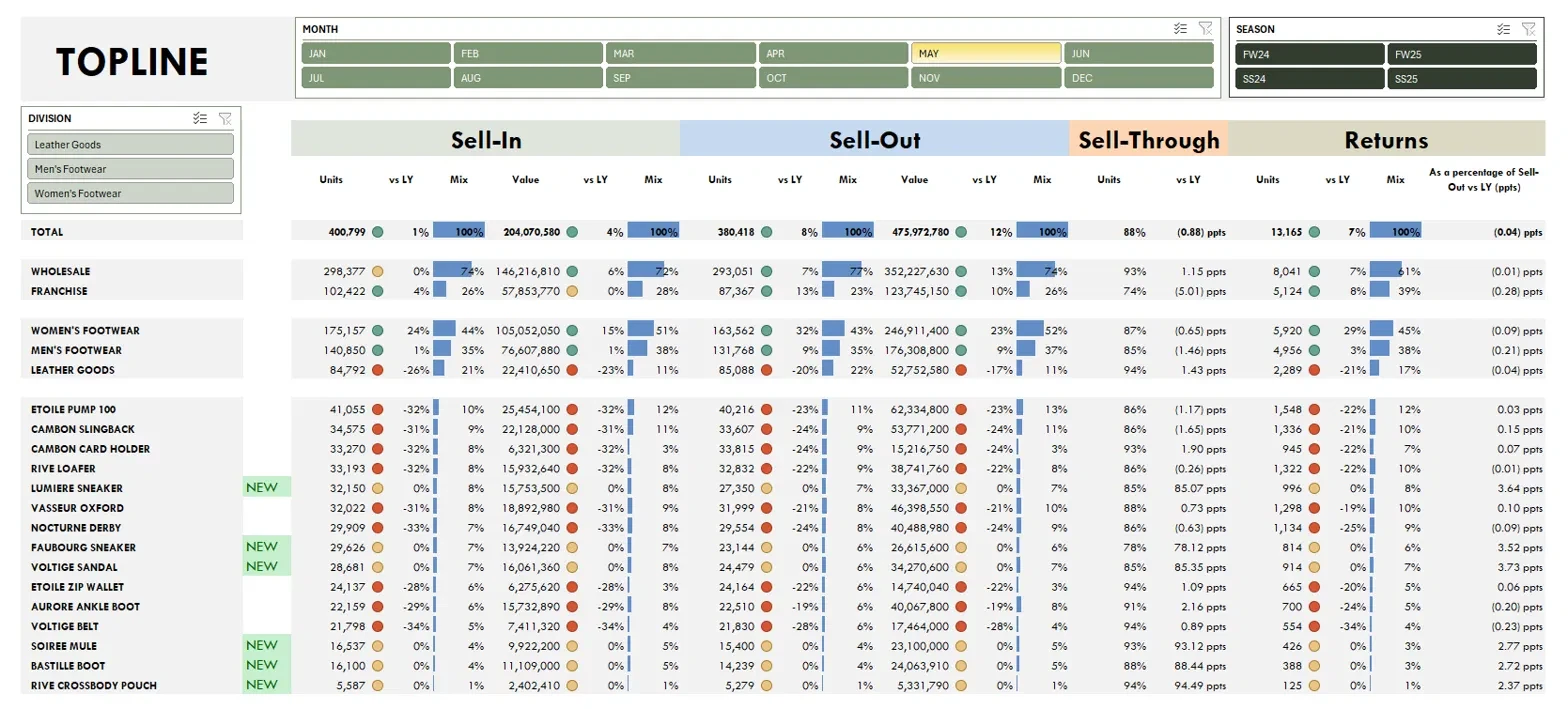
Topline view of the Vasseur Dashboard: Sell-In, Sell-Out, Sell-Through %, and Returns by Total, Wholesale/Franchise, Division, and Product, with Month and Season slicers live
Topline
Channel view of the Vasseur Dashboard: Sell-In, Sell-Out, Sell-Through %, and Returns by Region and named Account, with Region, Product, Channel, and Account slicers live
Channel
.xlsx
Vasseur Dashboard.xlsx

Download and explore the live slicers yourself.

344 KB Download ↓

Static Excel workbook with live slicers — full interactivity requires opening it in Excel.

What this dashboard is built for

Four flat, relational tables — no formulas baked into the file itself. The real data work — merges, transformations, and the native PivotTables behind the Business Review above — happens in Power Query on top of this source, not inside these sheets. Click a table to see a sample of the actual rows.

Accounts12 rows

Account ID · Account Name · Region · Country · Account Type

Two wholesale/franchise accounts per region across UK & Ireland, Nordics & Baltics, DACH, France & Benelux, Iberia, and Southern Europe.

Products16 rows

Product ID · Product Name · Category · Season · Wholesale Price (CHF) · Retail Price (CHF)

Women's Footwear, Men's Footwear, and Leather Goods, weighted so footwear carries the large majority of both SKU count and revenue.

Transactions_Monthly2,478 rows

Account ID · Product ID · Month (YYYY-MM) · Sell-In Units · Sell-In Value (CHF) · Sell-Out Units · Sell-Out Value (CHF) · Stock Units · Returns Units

One row per active account-product-month. Stock rolls forward consistently: prior stock + sell-in − sell-out − returns.

Transactions_Weekly11,627 rows

Account ID · Product ID · Week (ISO YYYY-Www) · Sell-Out Units · Sell-Out Value (CHF)

Weekly sell-out only, reconciling exactly to the monthly totals — the grain a weekly business review actually runs on.

The two files behind this case study. Download them directly.

.xlsx
Vasseur_Wholesale_Database_2024_2025.xlsx

The four-sheet source database: Accounts, Products, Transactions_Monthly, Transactions_Weekly.

388 KB Download ↓
.xlsx
Vasseur Dashboard.xlsx

The Wholesale Business Review: a formatted ONEPAGE summary plus the native pivot tables behind it.

344 KB Download ↓

This is the raw source layer. The sell-through, purchasing-trend, and customer-performance analysis built on top of it is live in the Wholesale Business Review Dashboard section above.